Understand the State of a Pipeline
You can monitor the execution of your pipeline to get an idea of when it is going to be caught up and if any troubleshooting may be required. The first part is more about diagnosing the activity of the pipeline, and the second is about the overall snapshot.
Monitoring the first run
After you created your first pipeline, you can watch its execution from different places in your account:
- Pipelines page
- Activities tab on the Pipeline page
Home tab
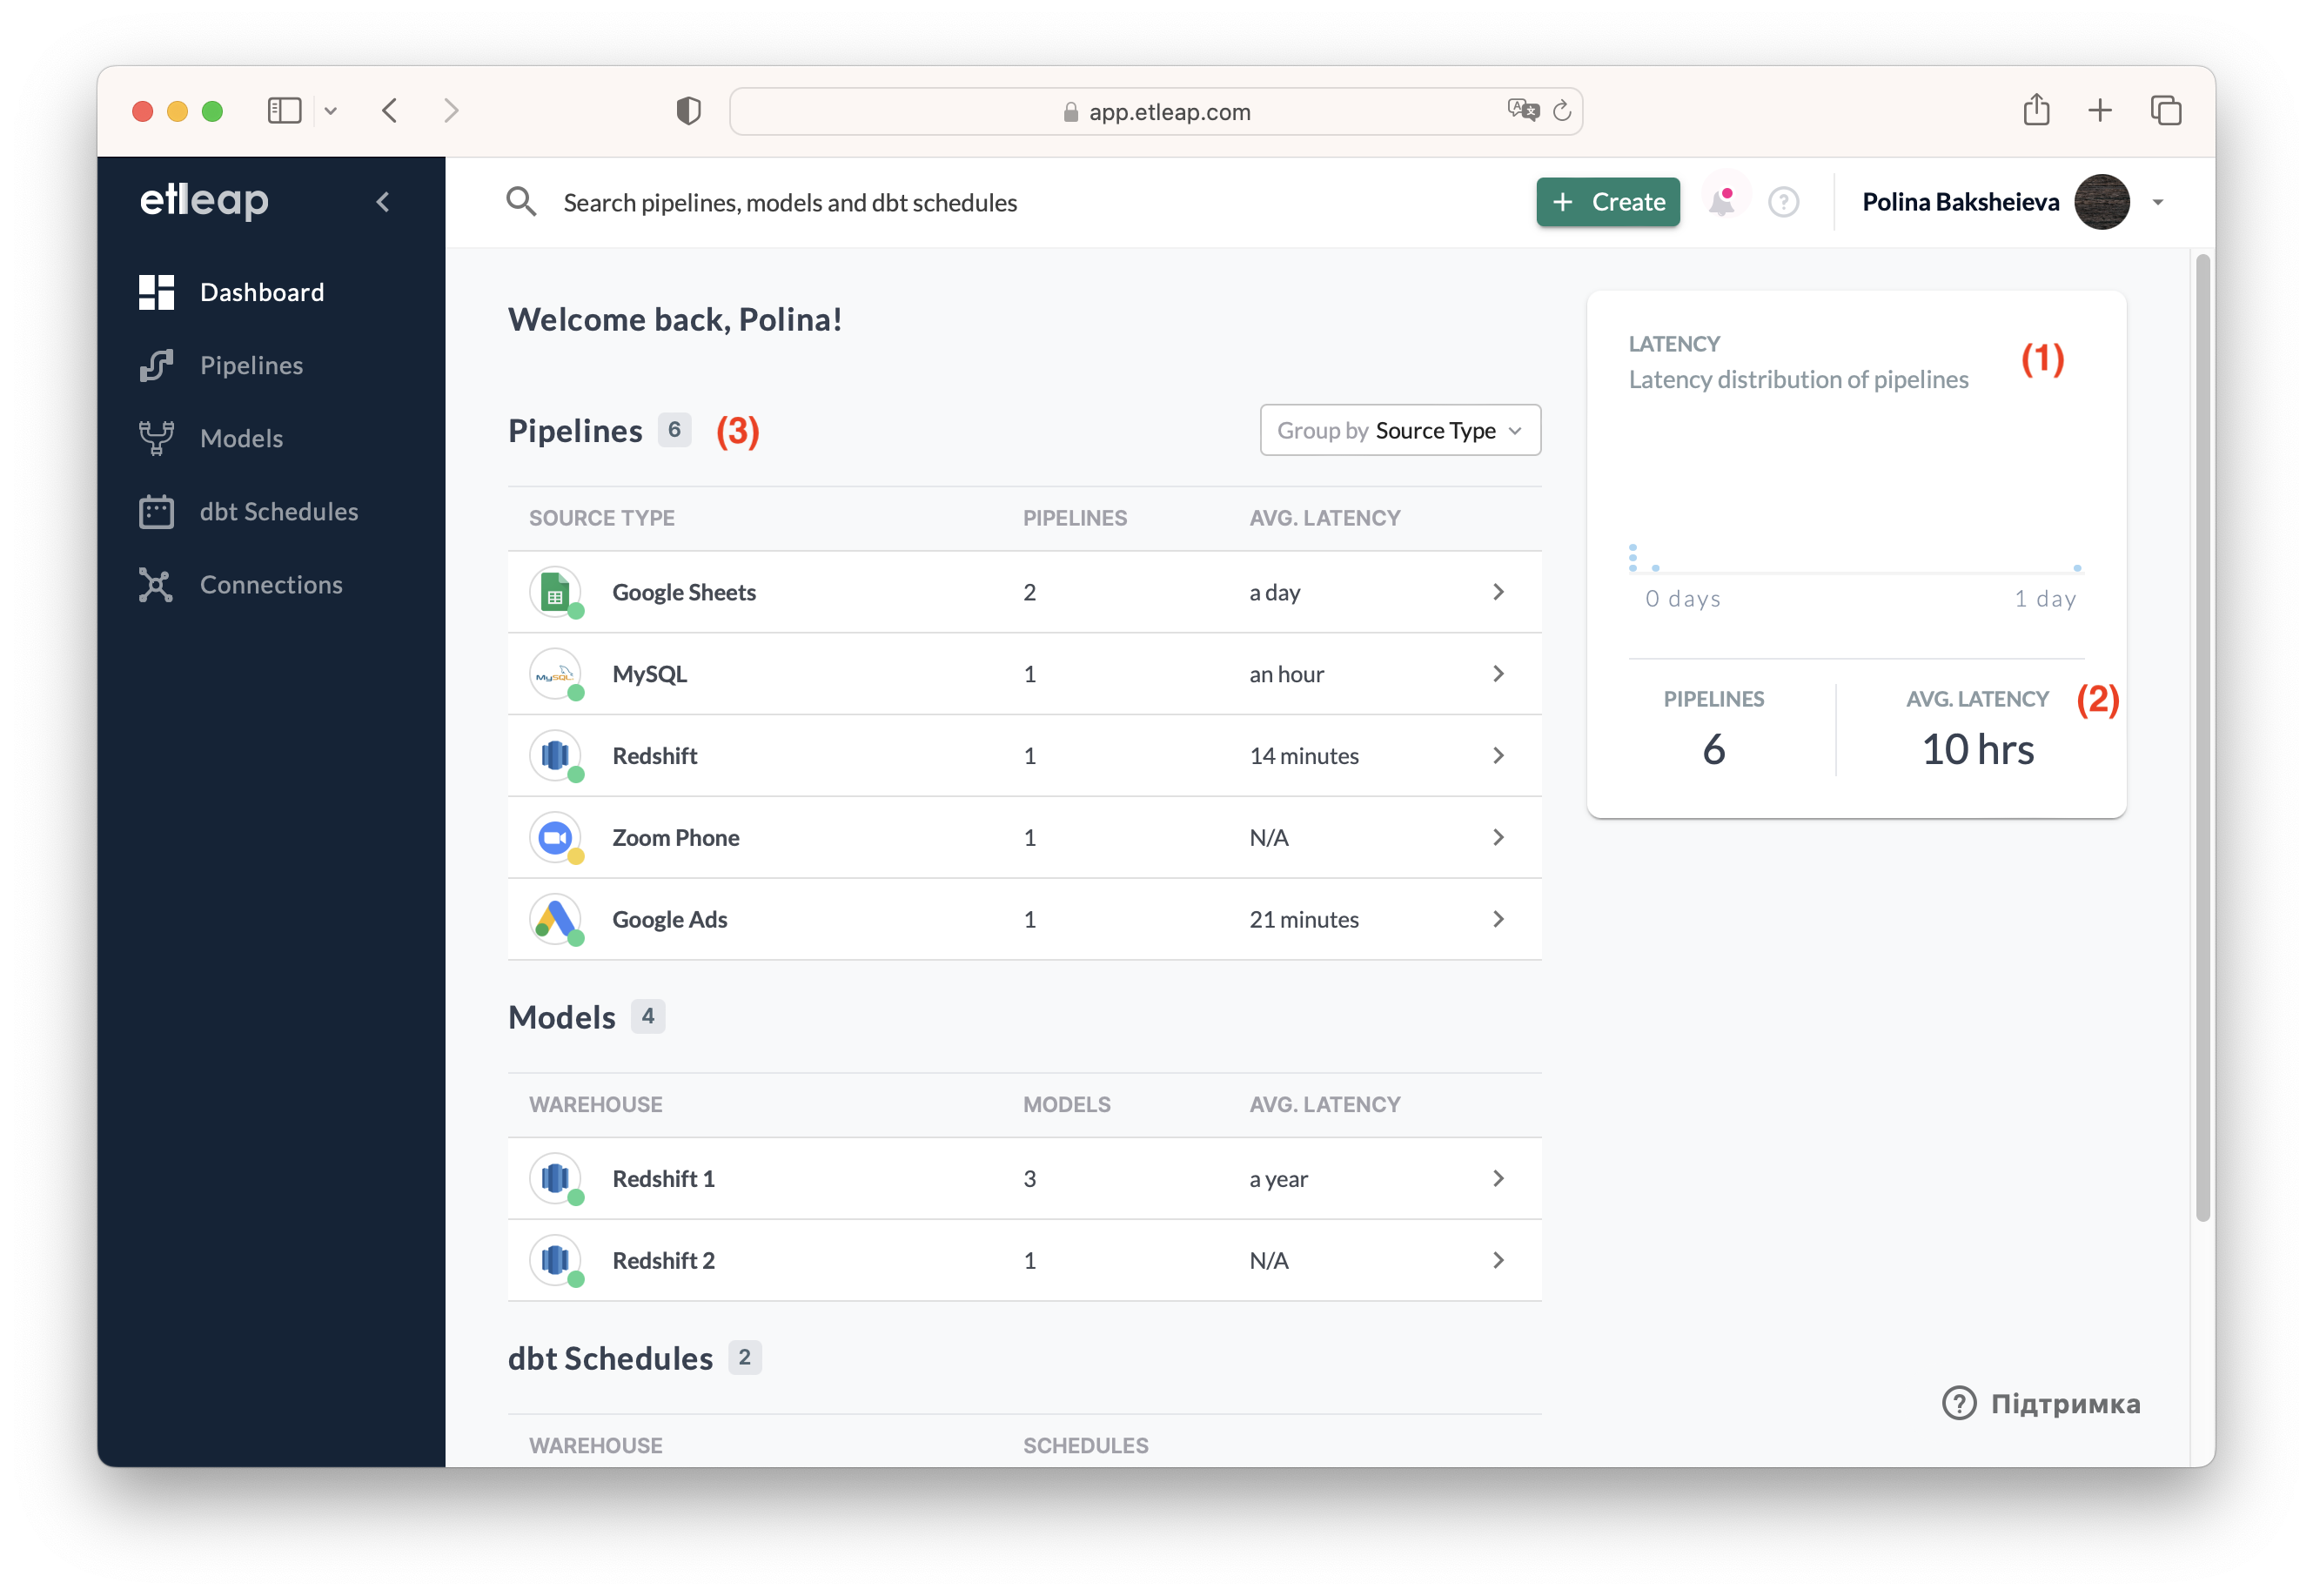
Here you have a dashboard that shows you:
- (1) the overall latency for all of your active pipelines. Latency is the upper bound on how out-of-date the data in the destination is compared to the source.
- (2) the average latency for all your pipelines.
- (3) a list of pipelines that you can group by source, source type, label, and destination. Average latency will be presented for whatever grouping you select.
Pipelenes page
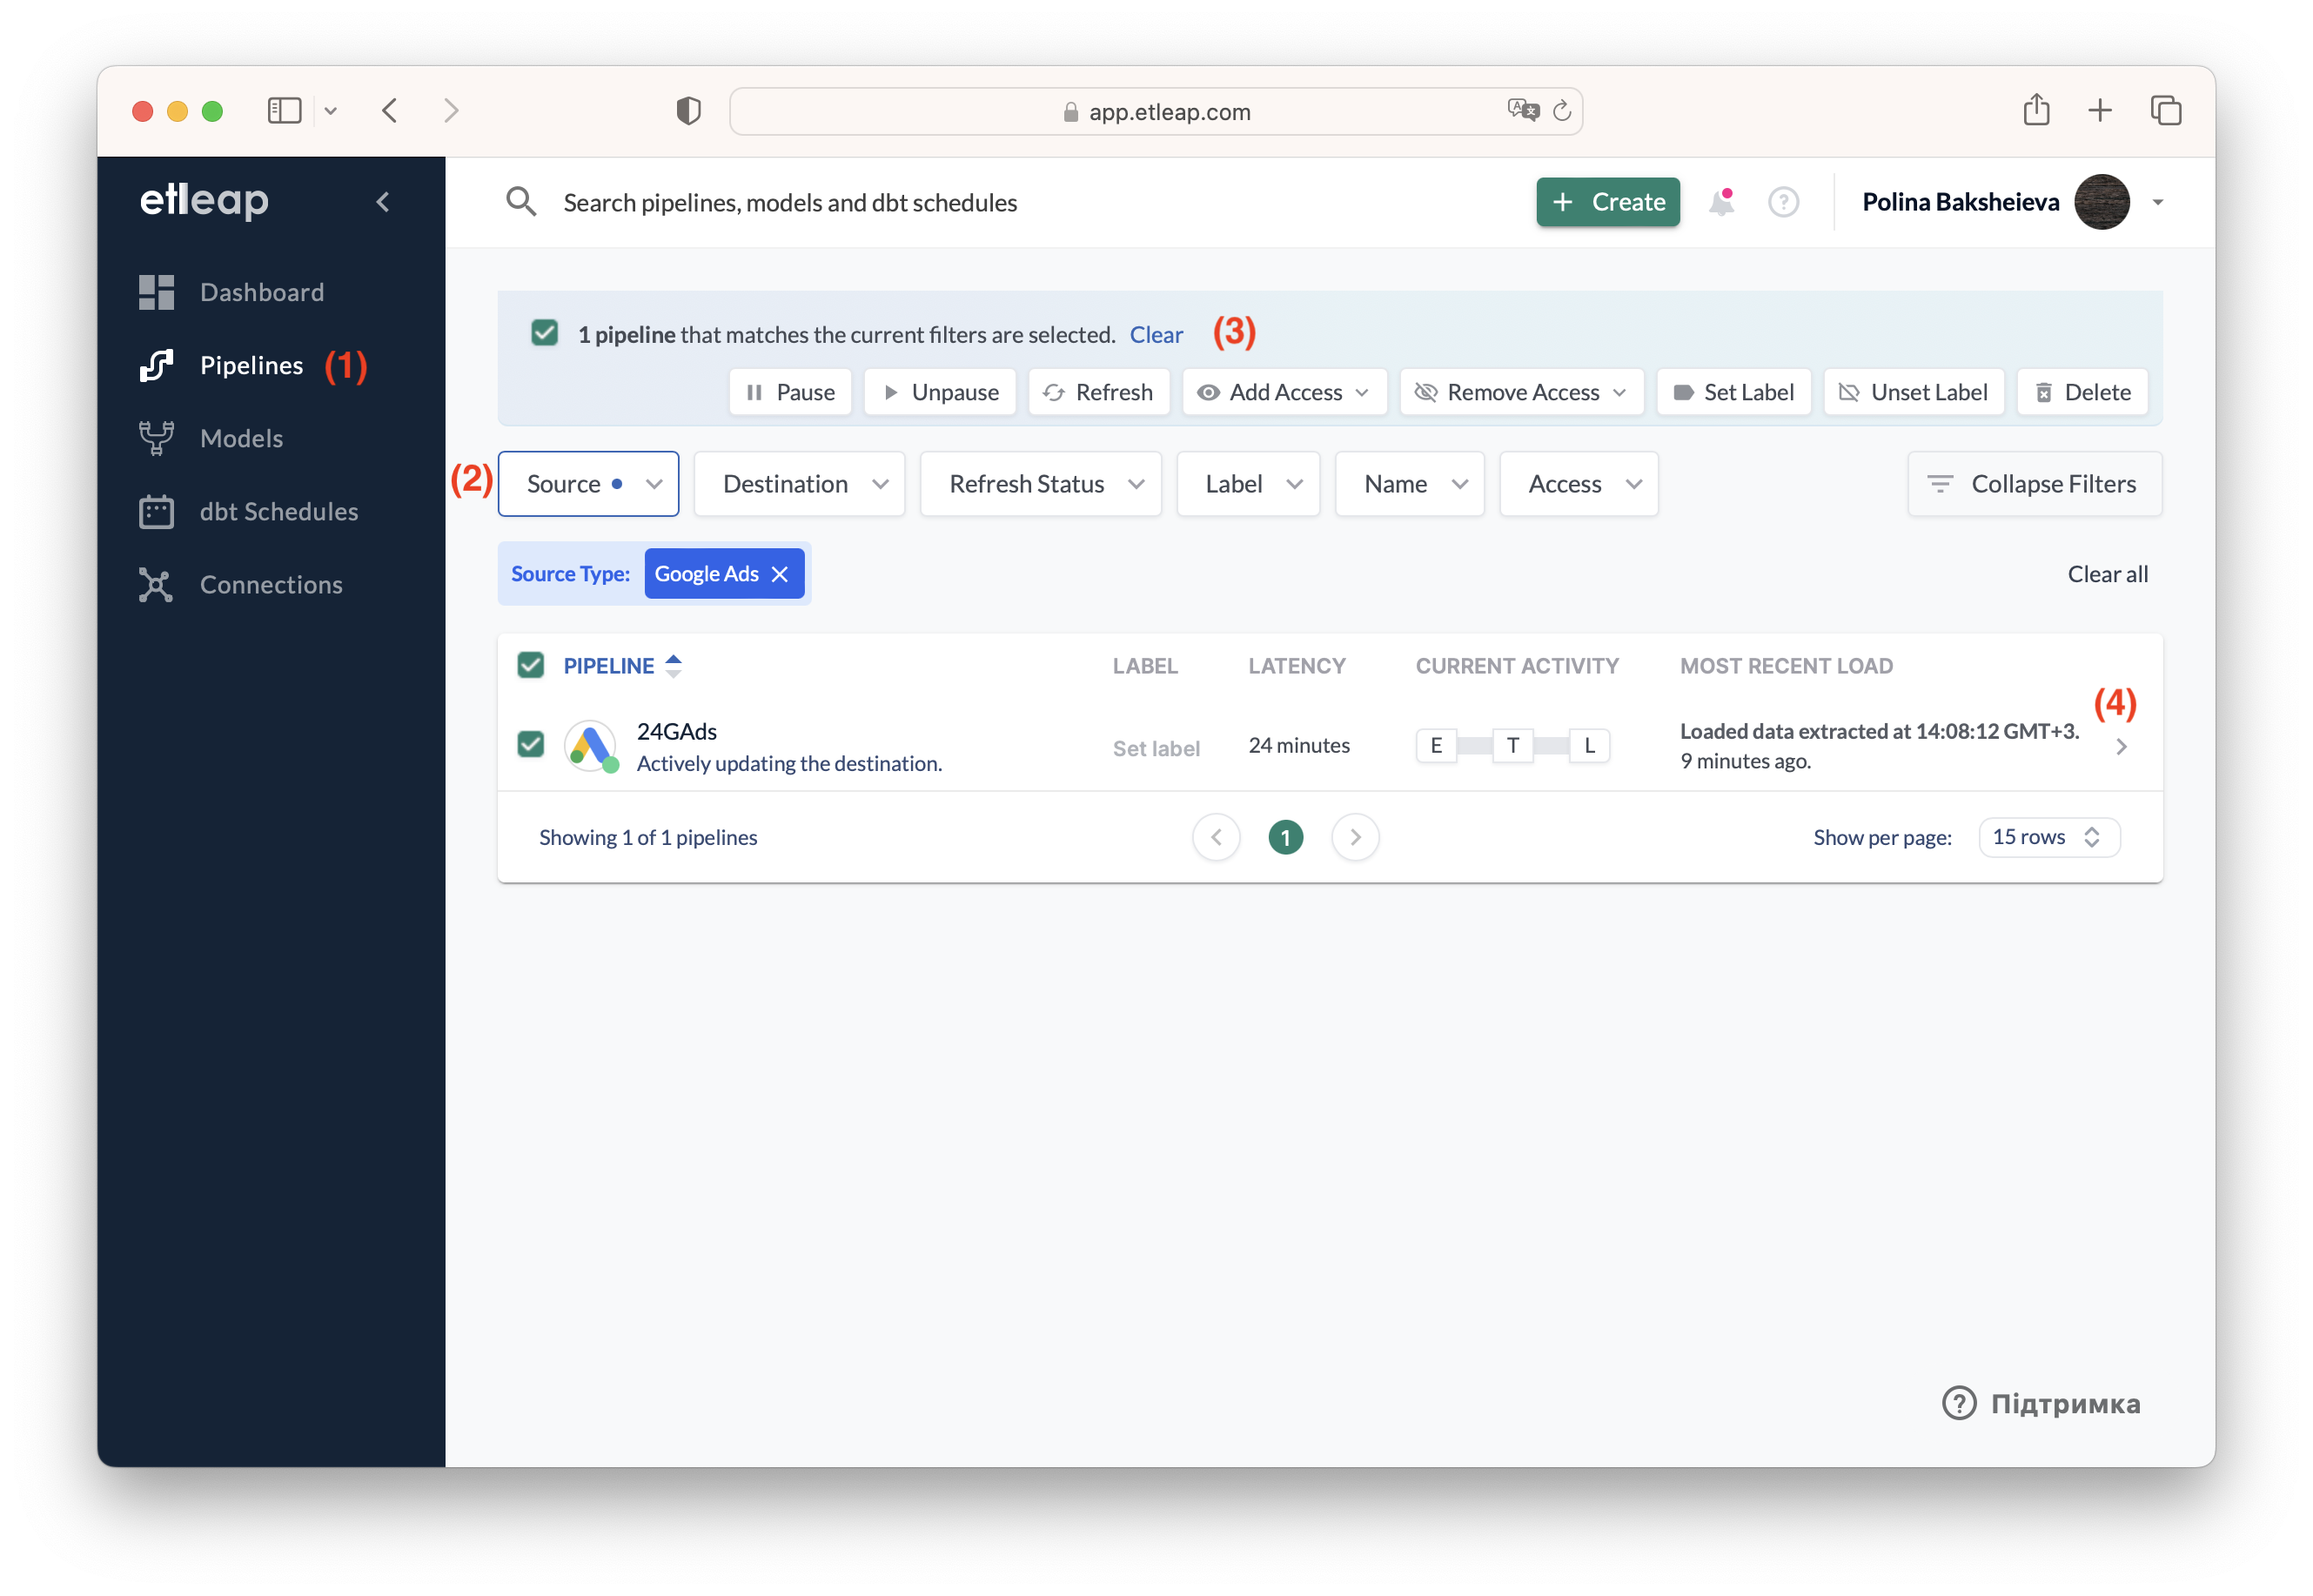
To access the Pipelines Page, click on the “Pipelines” link in the left menu of the application (1). Upon entering the Pipelines Page, you will find a comprehensive list of all your pipelines, providing a quick overview of your data processing operations.
You can sort and filter (2) the list of pipelines based on various criteria: Source, Destination, Refresh Status, Label, Name and Access.
For efficient pipeline management, you can perform batch actions on multiple pipelines simultaneously. These batch actions allow you to pause, unpause, refresh, delete, and manage access or labels (3).
The list provides essential information for each pipeline, including: status, current activity, most recent load.
To see more detailed information about a specific pipeline’s activity status, click on the arrow icon located on the right-hand side of the pipeline’s row (4), or on the pipeline name. This will take you to the Overview tab on the respective Pipeline page. To view the activities of the pipeline, navigate to the “Activities” tab.
Activities tab on the Pipeline page
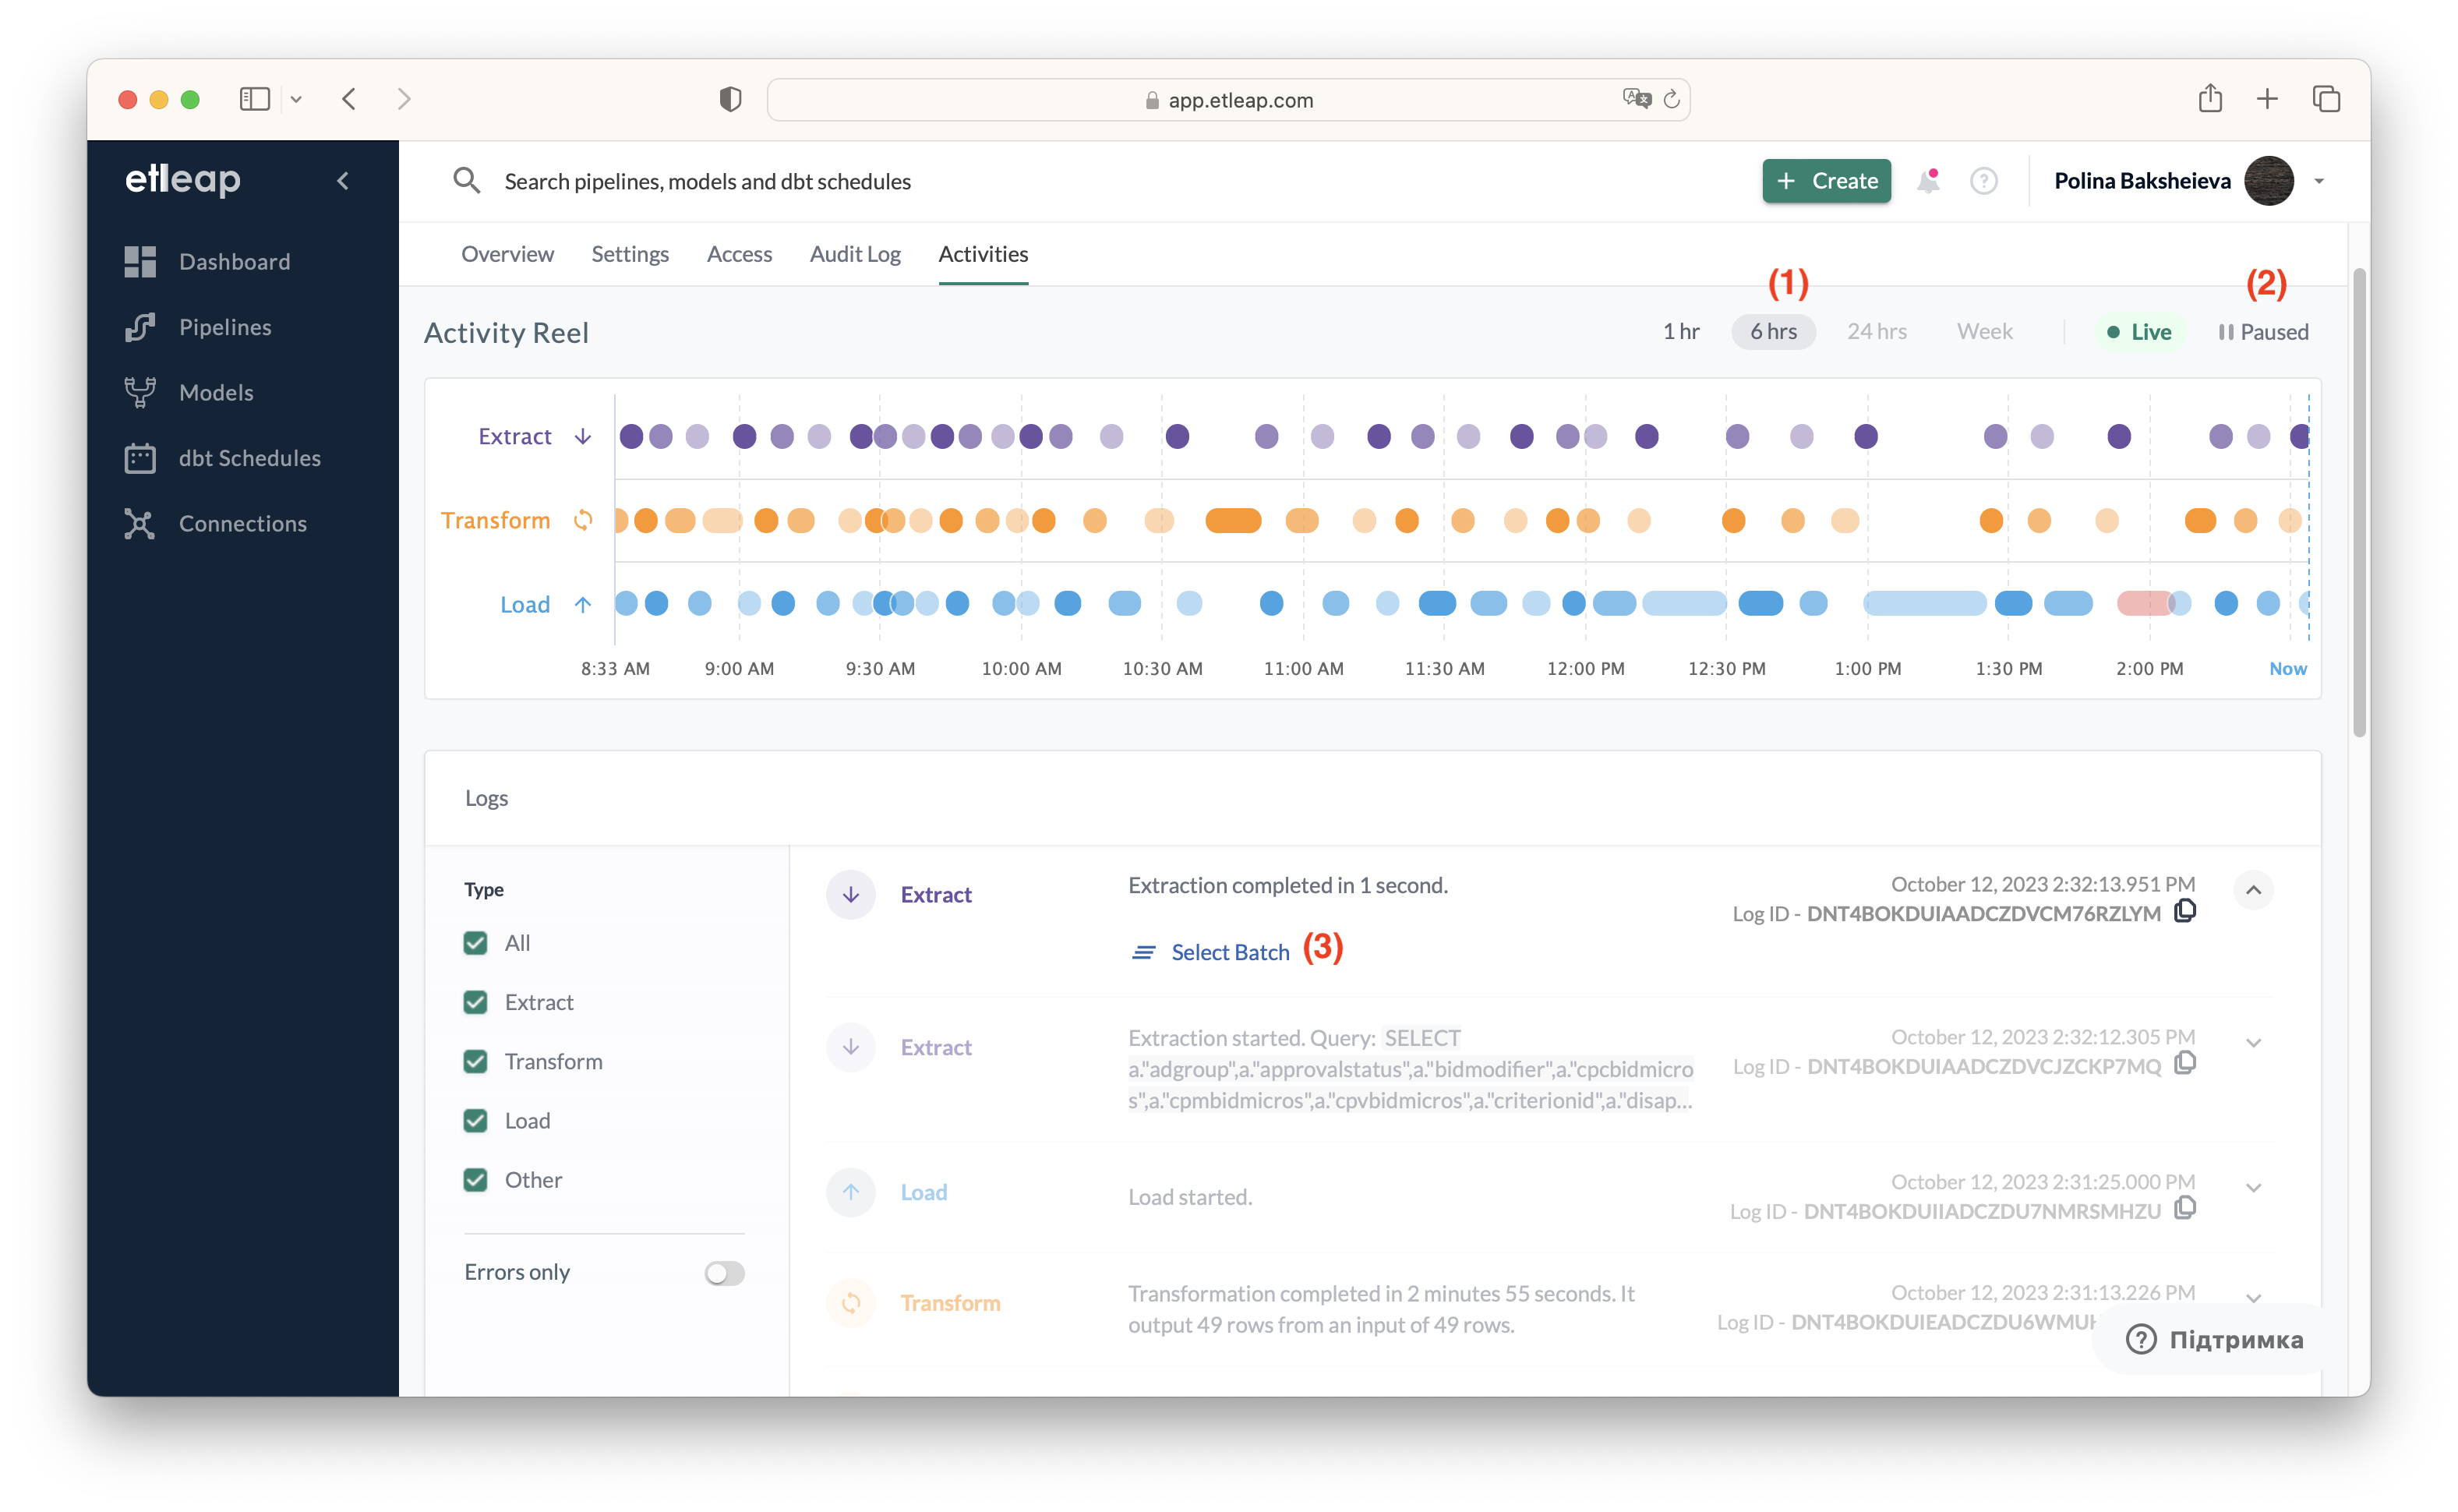
The Activities tab provides a comprehensive overview of your pipeline’s activities, including extractions, transformations, and loading processes.
Activity reel
The activity timeline displays a graphical representation of activities over time, allowing you to track the progress of your pipeline. Successful activities are color-coded according to their respective types. You can adjust the displayed time frame by selecting predefined options such as “1h,” “6h,” “24h,” or “week” (1). Additionally, a custom time frame can be selected in “Paused” mode (2), aligning with your specific time preferences.
Activity Logs
Beneath the activity timeline, a list of activity logs provides detailed information about each activity batch. You can select a batch by clicking on the corresponding activity in the timeline or using the “Select Batch” button (3) within the log list. For more information on when certain logs are shown, see Activity Log Types
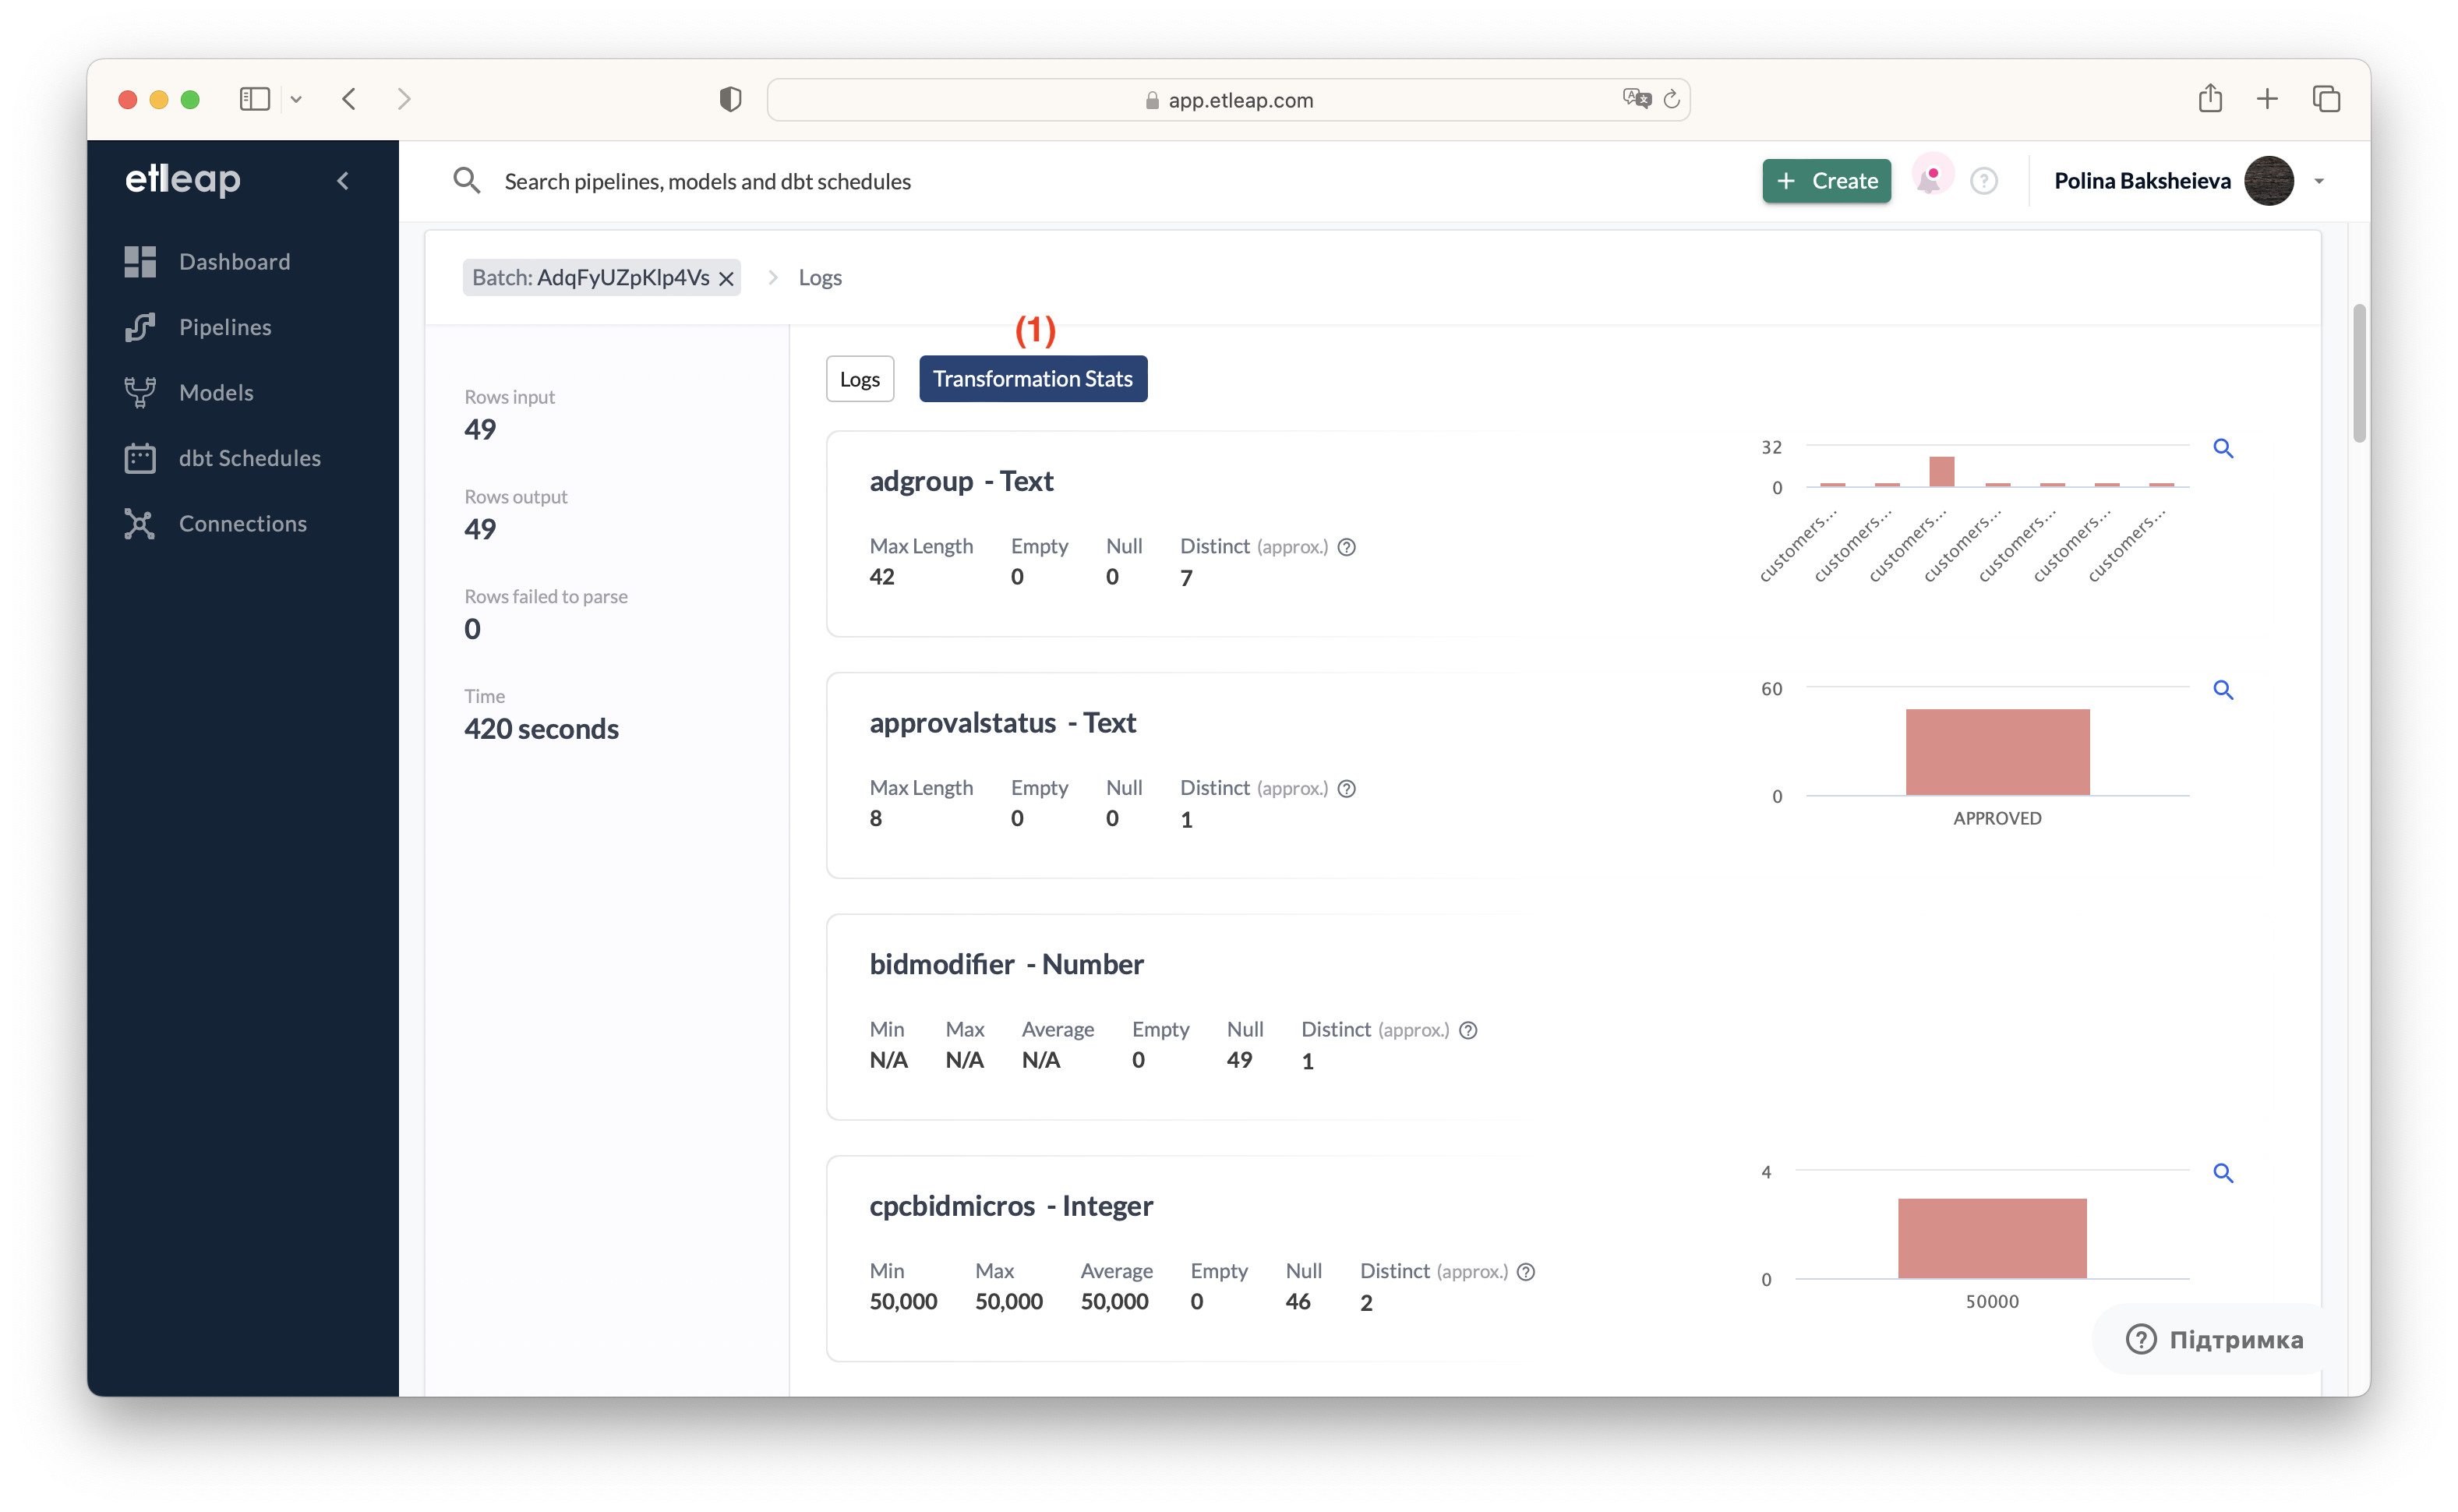
Transform report
If transformation statistics are available for a selected batch, you can seamlessly access the “Transformation Stats” tab (1). This report shows a summary of descriptive statistics for the table that is created with the current pipeline. From this report you can get an impression of the data loaded, and whether it fits with your expectations. For instance, if any rows were not parsed and may need additional wrangling, or the values in columns does not make sense: have a wrong format, or outliers, or nulls.
Pipeline Page
The Pipeline page offers a few more insights into the state of your pipeline. The information on the Pipeline Page can be used for both troubleshooting the initial execution and continuous monitoring when the pipeline has been running smoothly for some time but then got stuck. The Pipeline Page also provides an opportunity to check all pipeline, source, and destination settings, and change some of them on the fly.
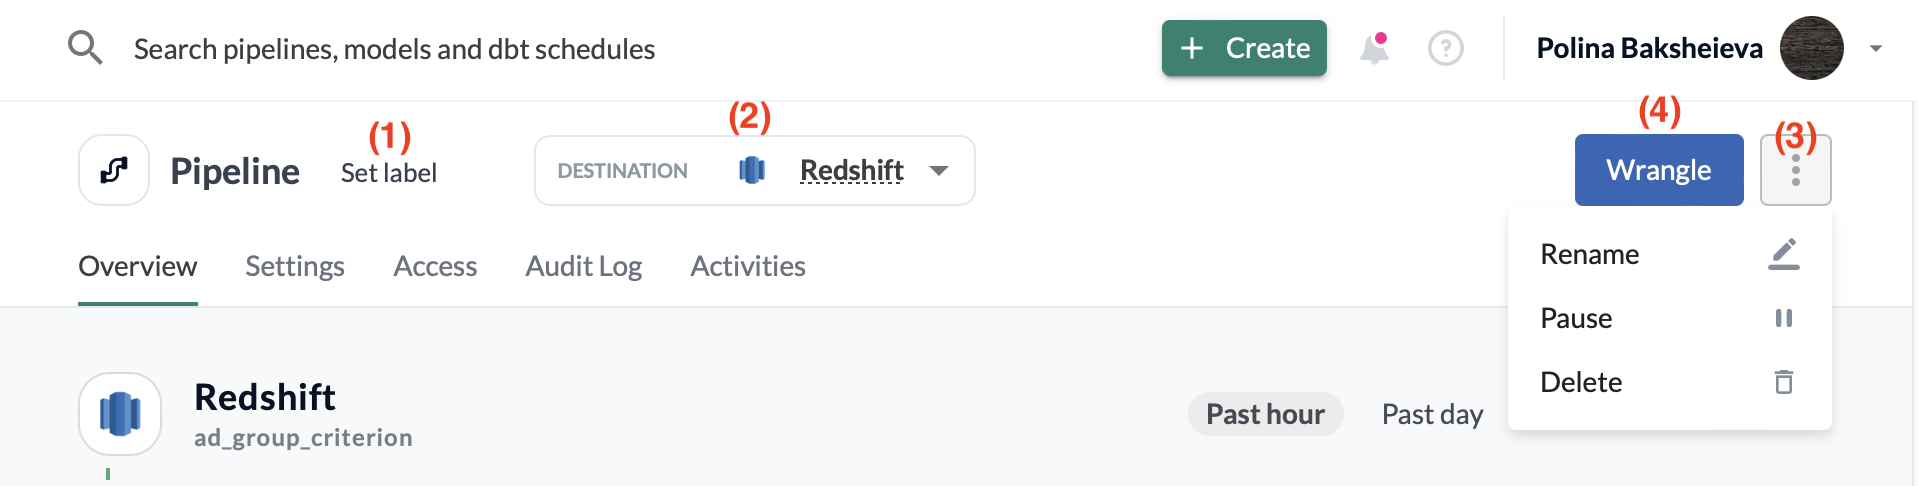
Pipeline top pane
The Pipeline top pane displays the pipeline name and allows you to edit the associated label (1). You can also select the destination (2) for which the data is displayed. Additionally, you have the option to pause or resume the pipeline, rename it, delete it (3), and access to the data Wrangler (4).
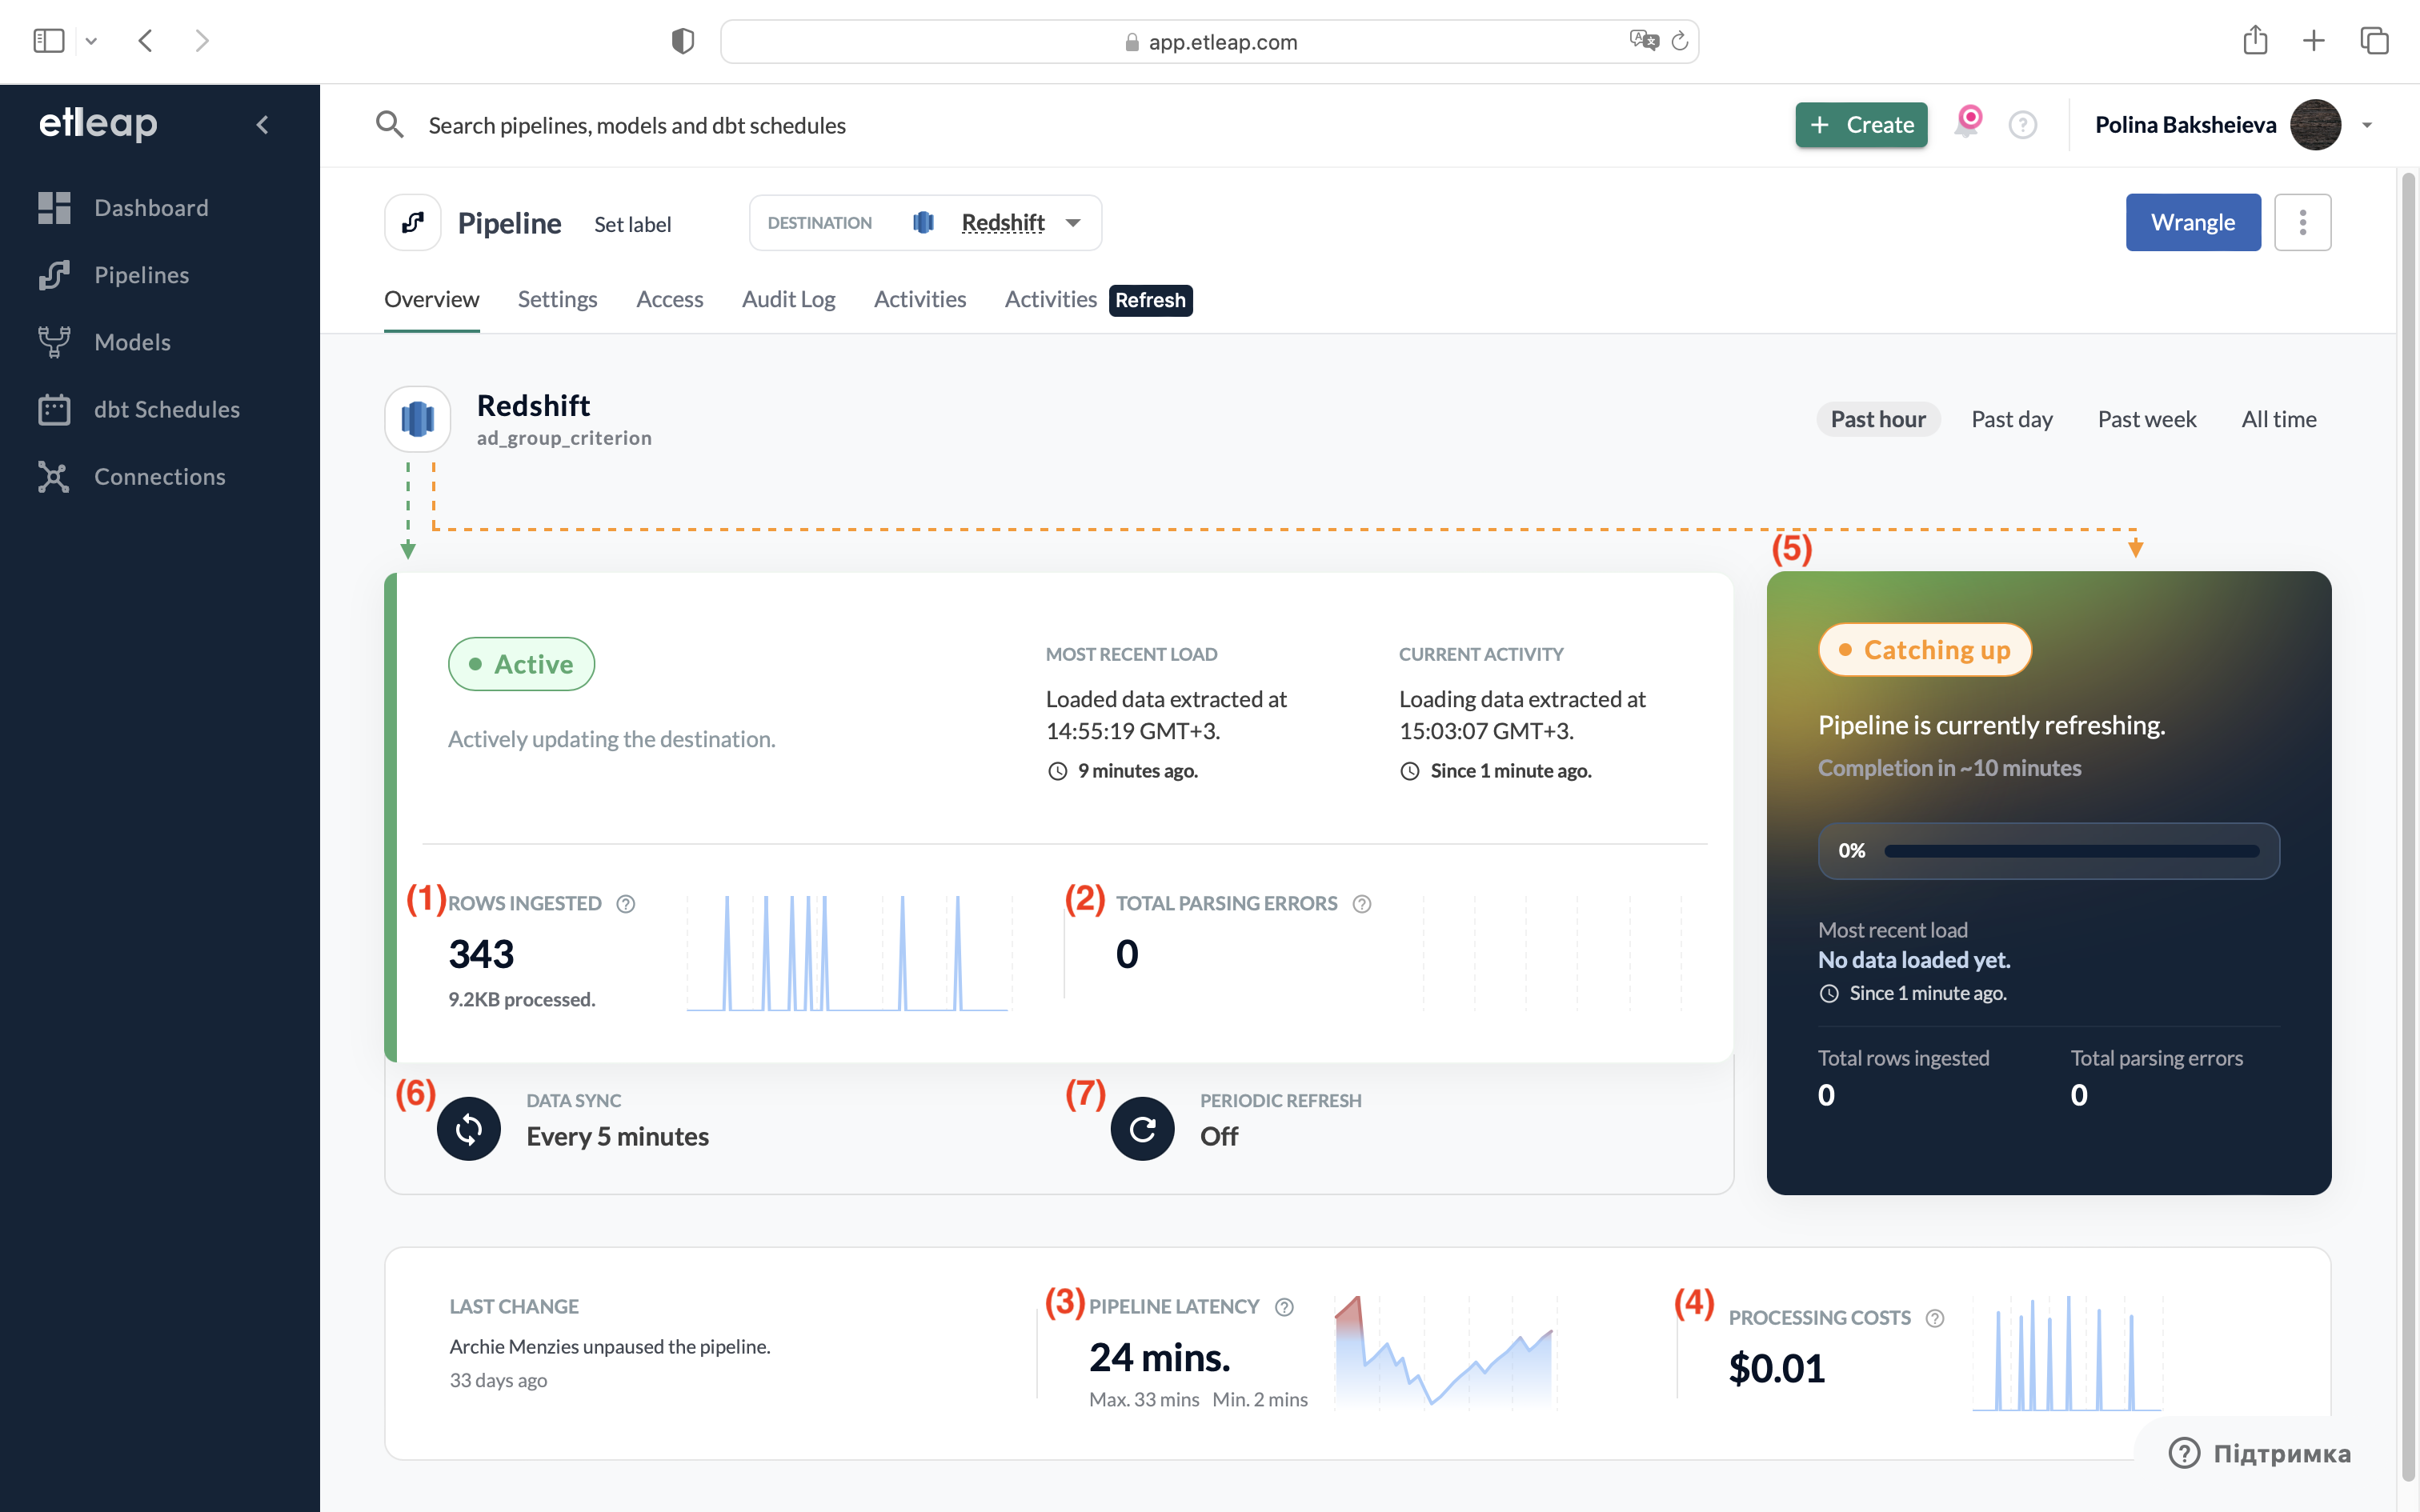
Pipeline Overview
The pipeline overview tab displays the most important statistics, such as rows ingested (1), parsing errors (2), latency (3) and processing costs (4). It also provides information about the pipeline, including: the status, most recent load, last change, current activity and refresh status (5). The tab also allows you to control certain settings, such as data sync (6) and refresh intervals (7).
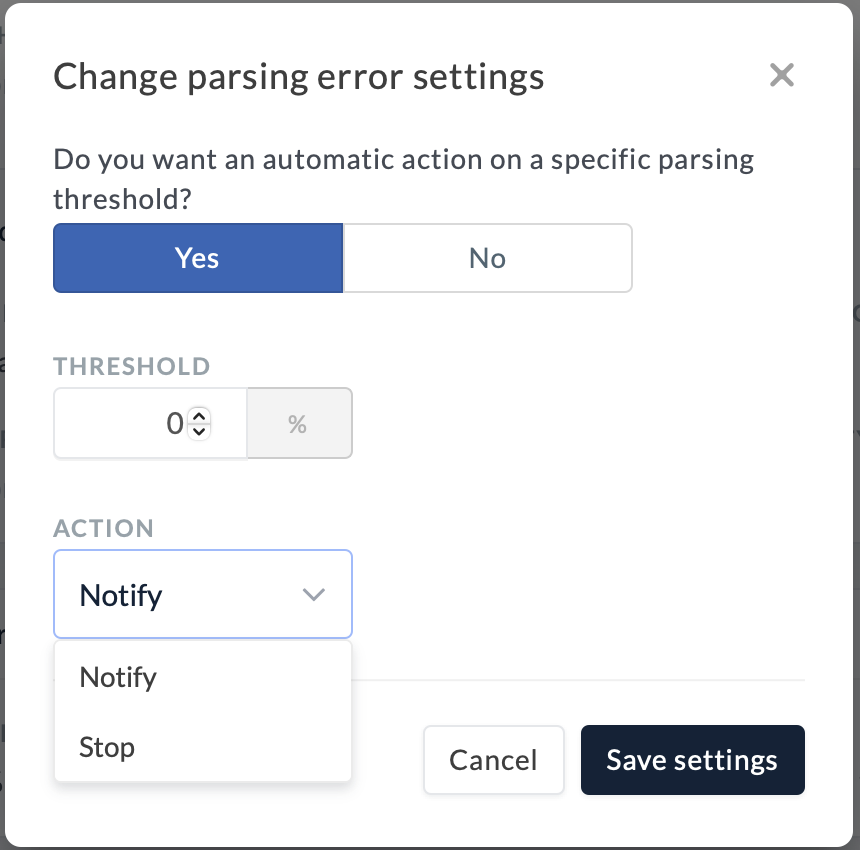
Parsing errors
A more detailed tutorial on parsing errors can be accessed here. You can specify how the pipeline should deal with the parsing errors in the Settings.
You can set a threshold beyond which some action must happen. It can be a percentage of parsing errors per transformation, and you can choose either to receive a notification or to stop the pipeline execution completely. Remember to hit “Save Settings” every time you change them.
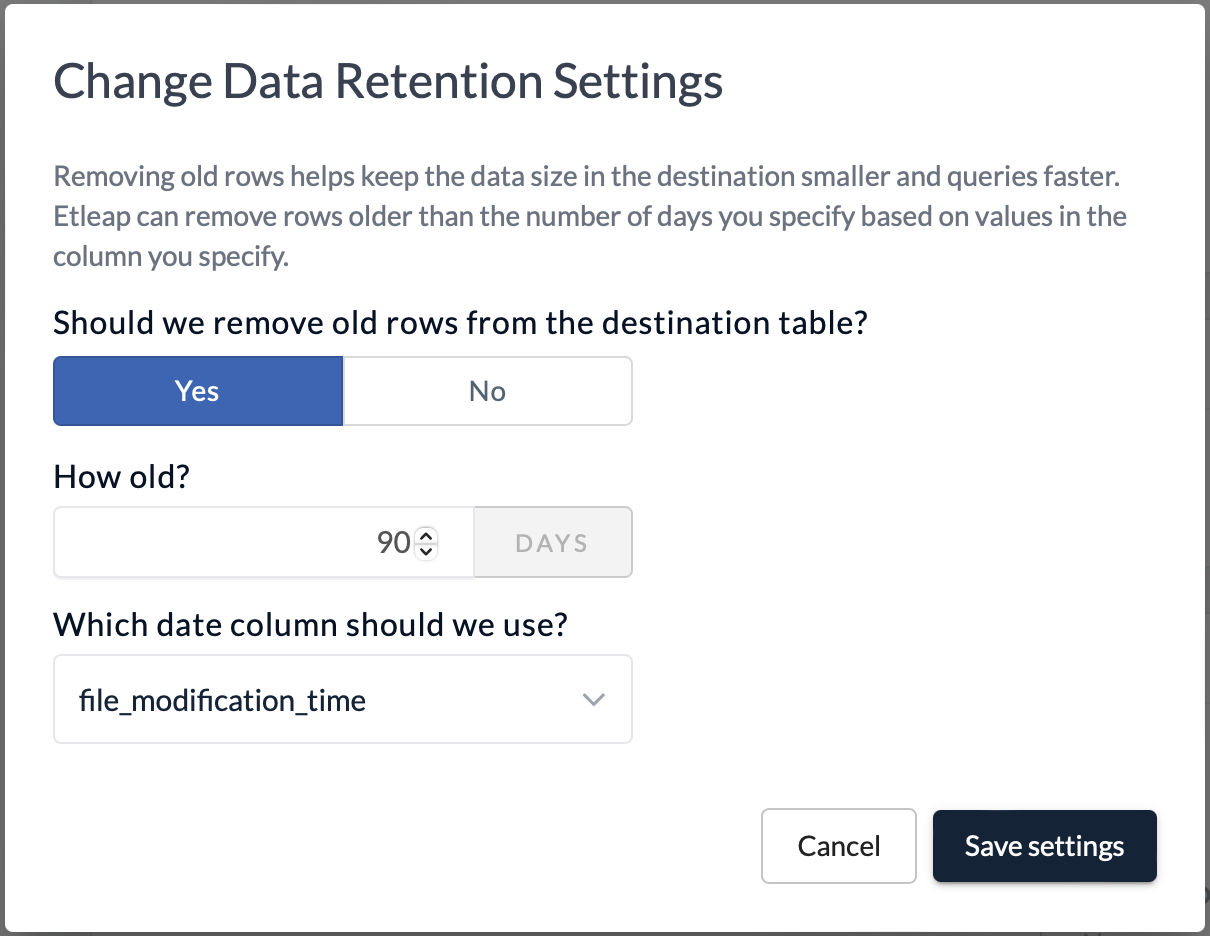
Data retention
Data retention settings allow you to monitor your data volumes based on a date column and drop the records you do not need any longer. You can access the Settings to view it and specify which date column should be used to define the age of the rows, and what age they are allowed to reach. Older rows will be deleted from your table.